Who are we reaching and how are they getting here
Current website Demographics
Nearly all traffic is currently being pushed from in-person conversations Earl, the farm owner, has with his customers at the farmers market. This often means people are looking up the website on their mobile devices. This is supported by our analytics showing 60% of all traffic is on mobile. We also know most of this traffic is most likely through the in-person interactions as many are direct site visits or from google suggesting people are seeking out the site directly. We can also tell that people are not finding the information engaging as our bounce rate is at nearly 50%.
This set of data has given us clarity on how to prioritize our objectives. We will design the new site mobile-first and try to create a navigation and content structure that this more engaging to help reduce the bounce rate.
Farmers Market Patrons
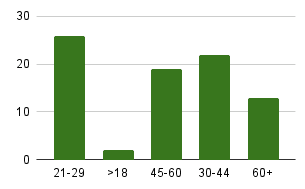
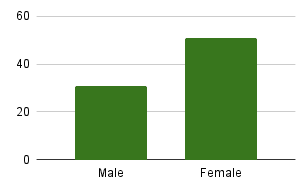
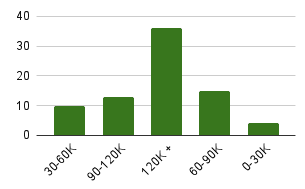
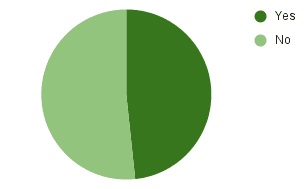
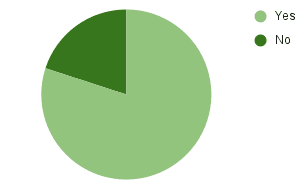
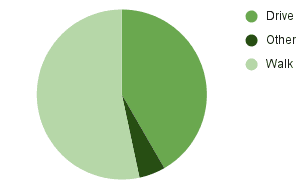
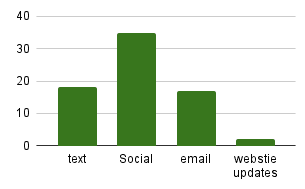
The advantage of having a small pool of customers in this case is ease of access. We decided to conduct a survey; of the Covington KY Farmers market that Hampton Ridge Farms exclusively attends. We conducted two surveys, the first of which was to collect demographic data (age, gender, income, etc) and the second was to learn more about the behavior and purchasing decisions of the market. The charts below represent the results of these two surveys.
Age
Gender
Income
Do you consume meat products?
Do you consider farming practices when purchasing
Do you walk, drive, or use other transport?
What form of communication do you prefer?
Do you come for specific vendors or to browes?
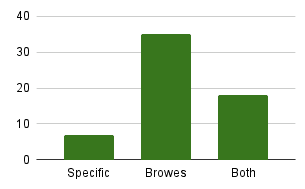
The advantage of having a small pool of customers in this case is ease of access. We decided to conduct a survey; of the Covington KY Farmers market that Hampton Ridge Farms exclusively attends. We conducted two surveys, the first of which was to collect demographic data (age, gender, income, etc) and the second was to learn more about the behavior and purchasing decisions of the market. The charts below represent the results of these two surveys.
User Personas
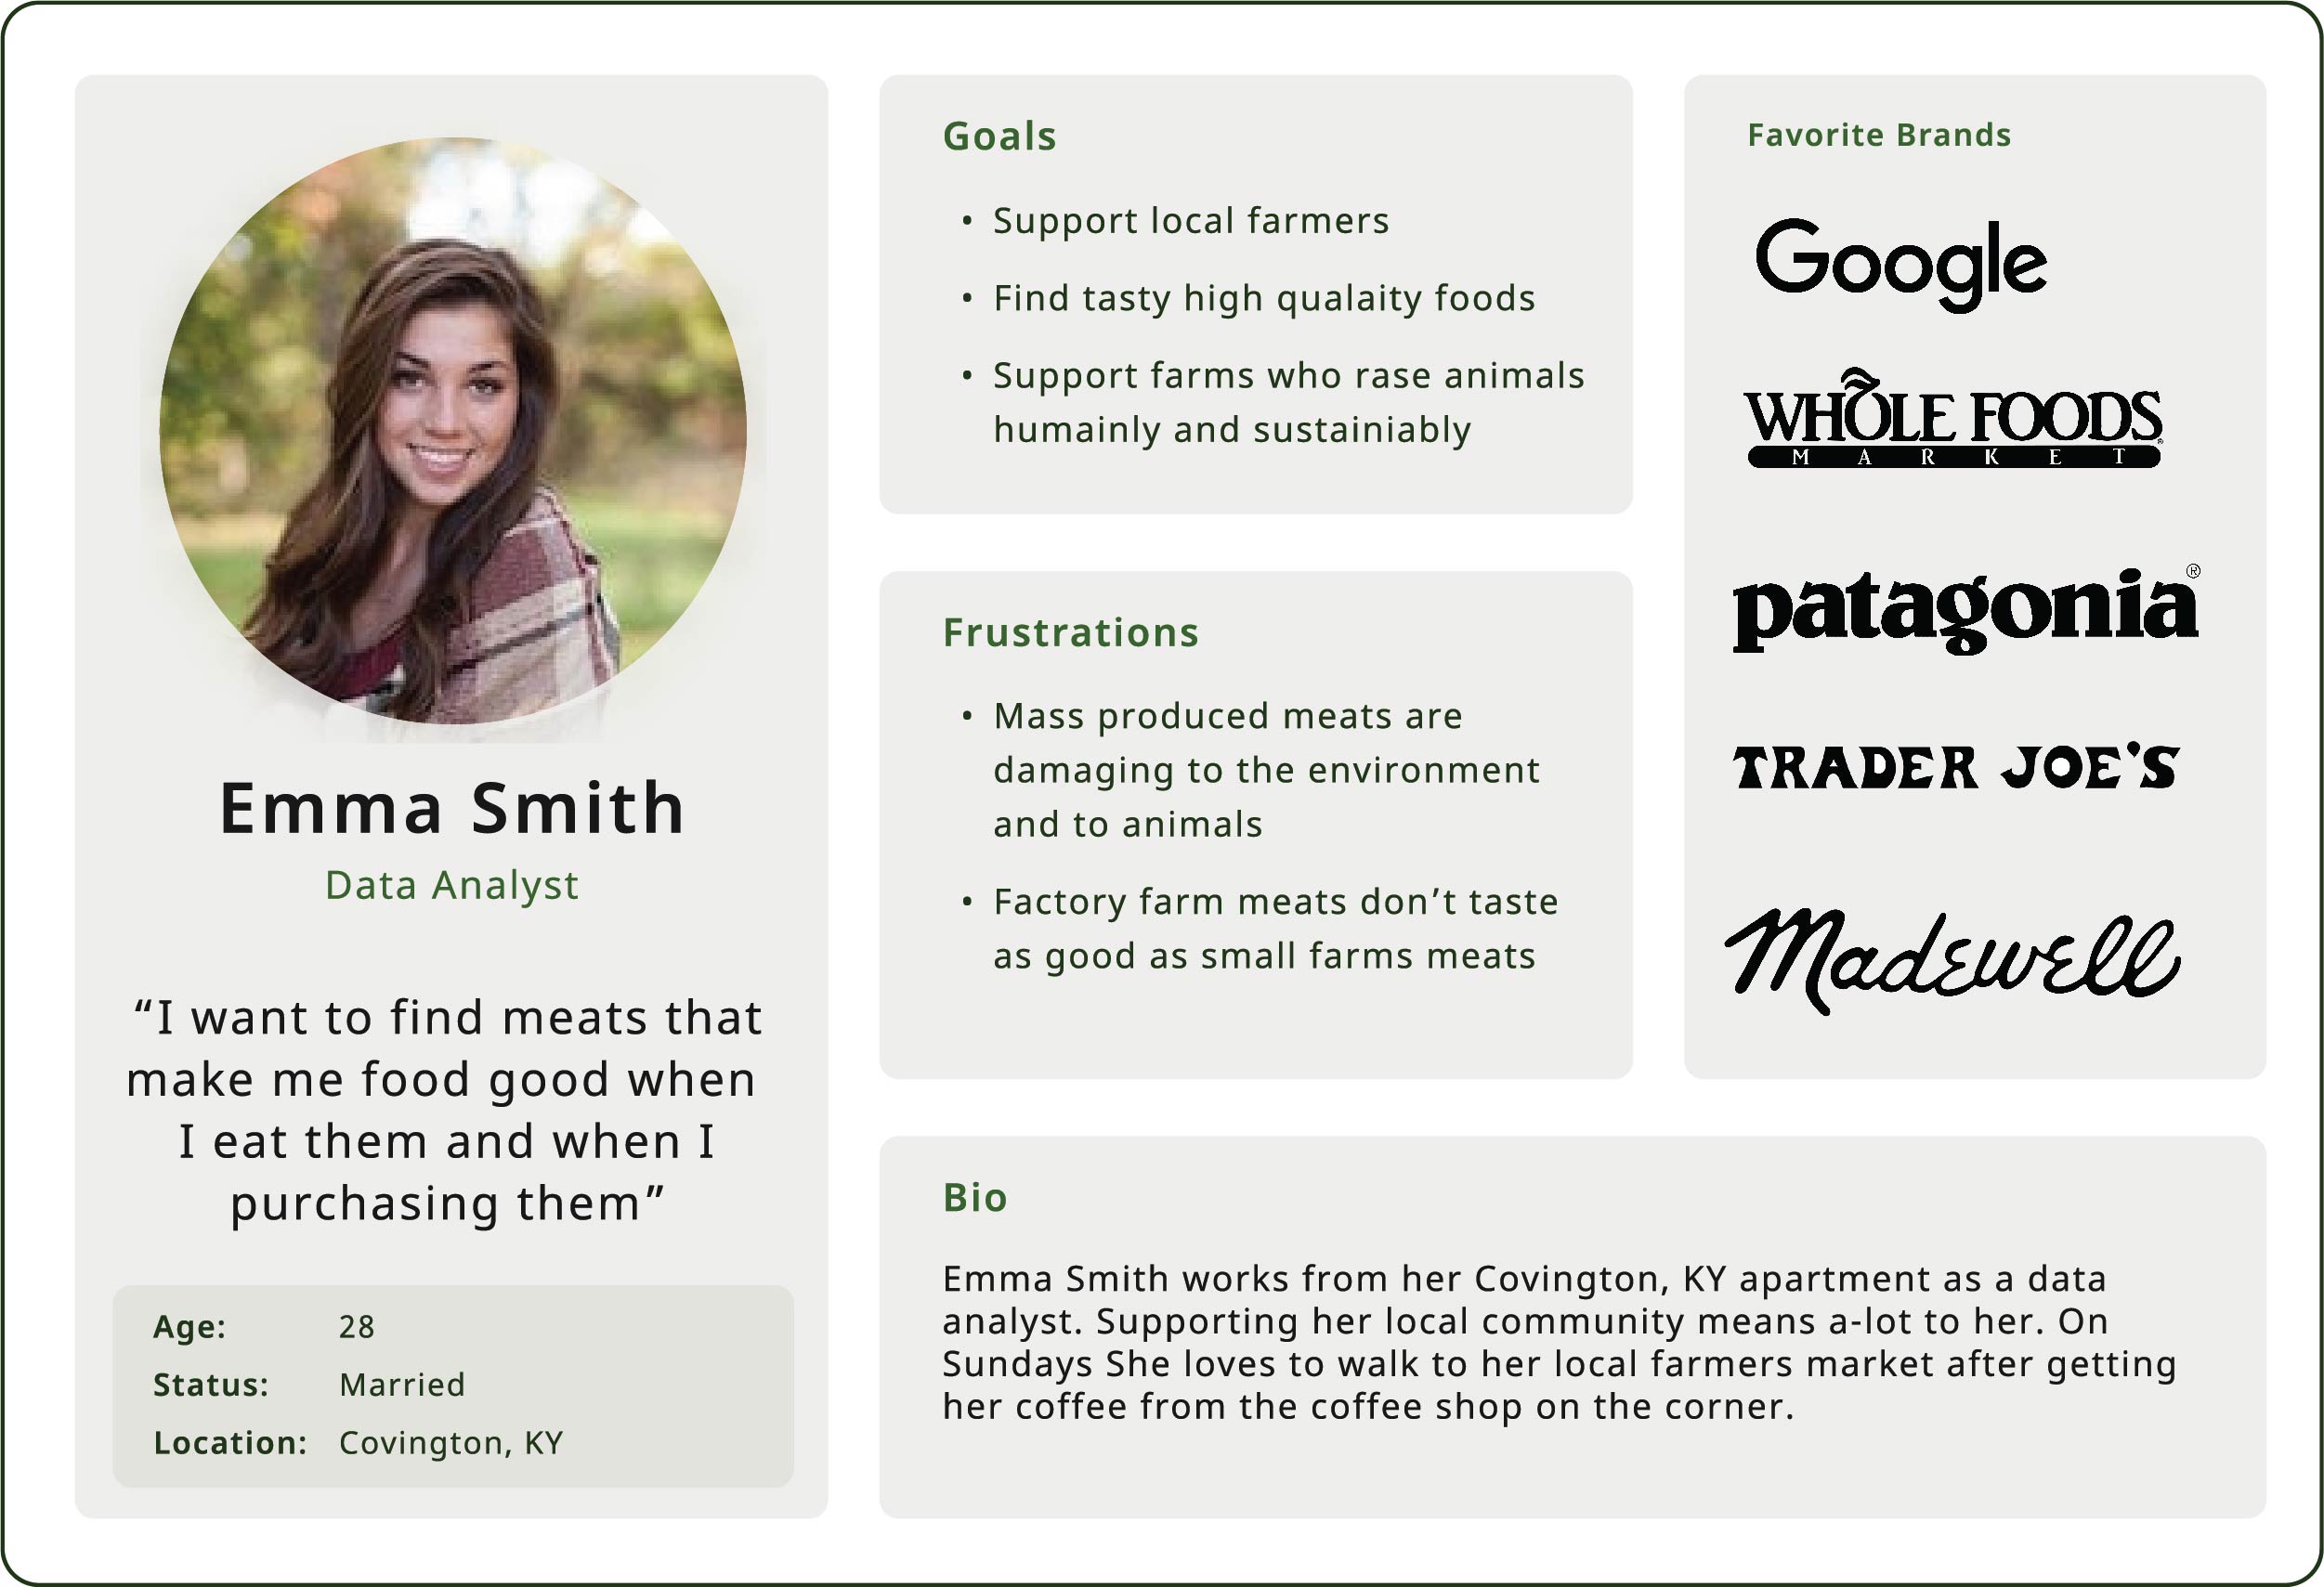
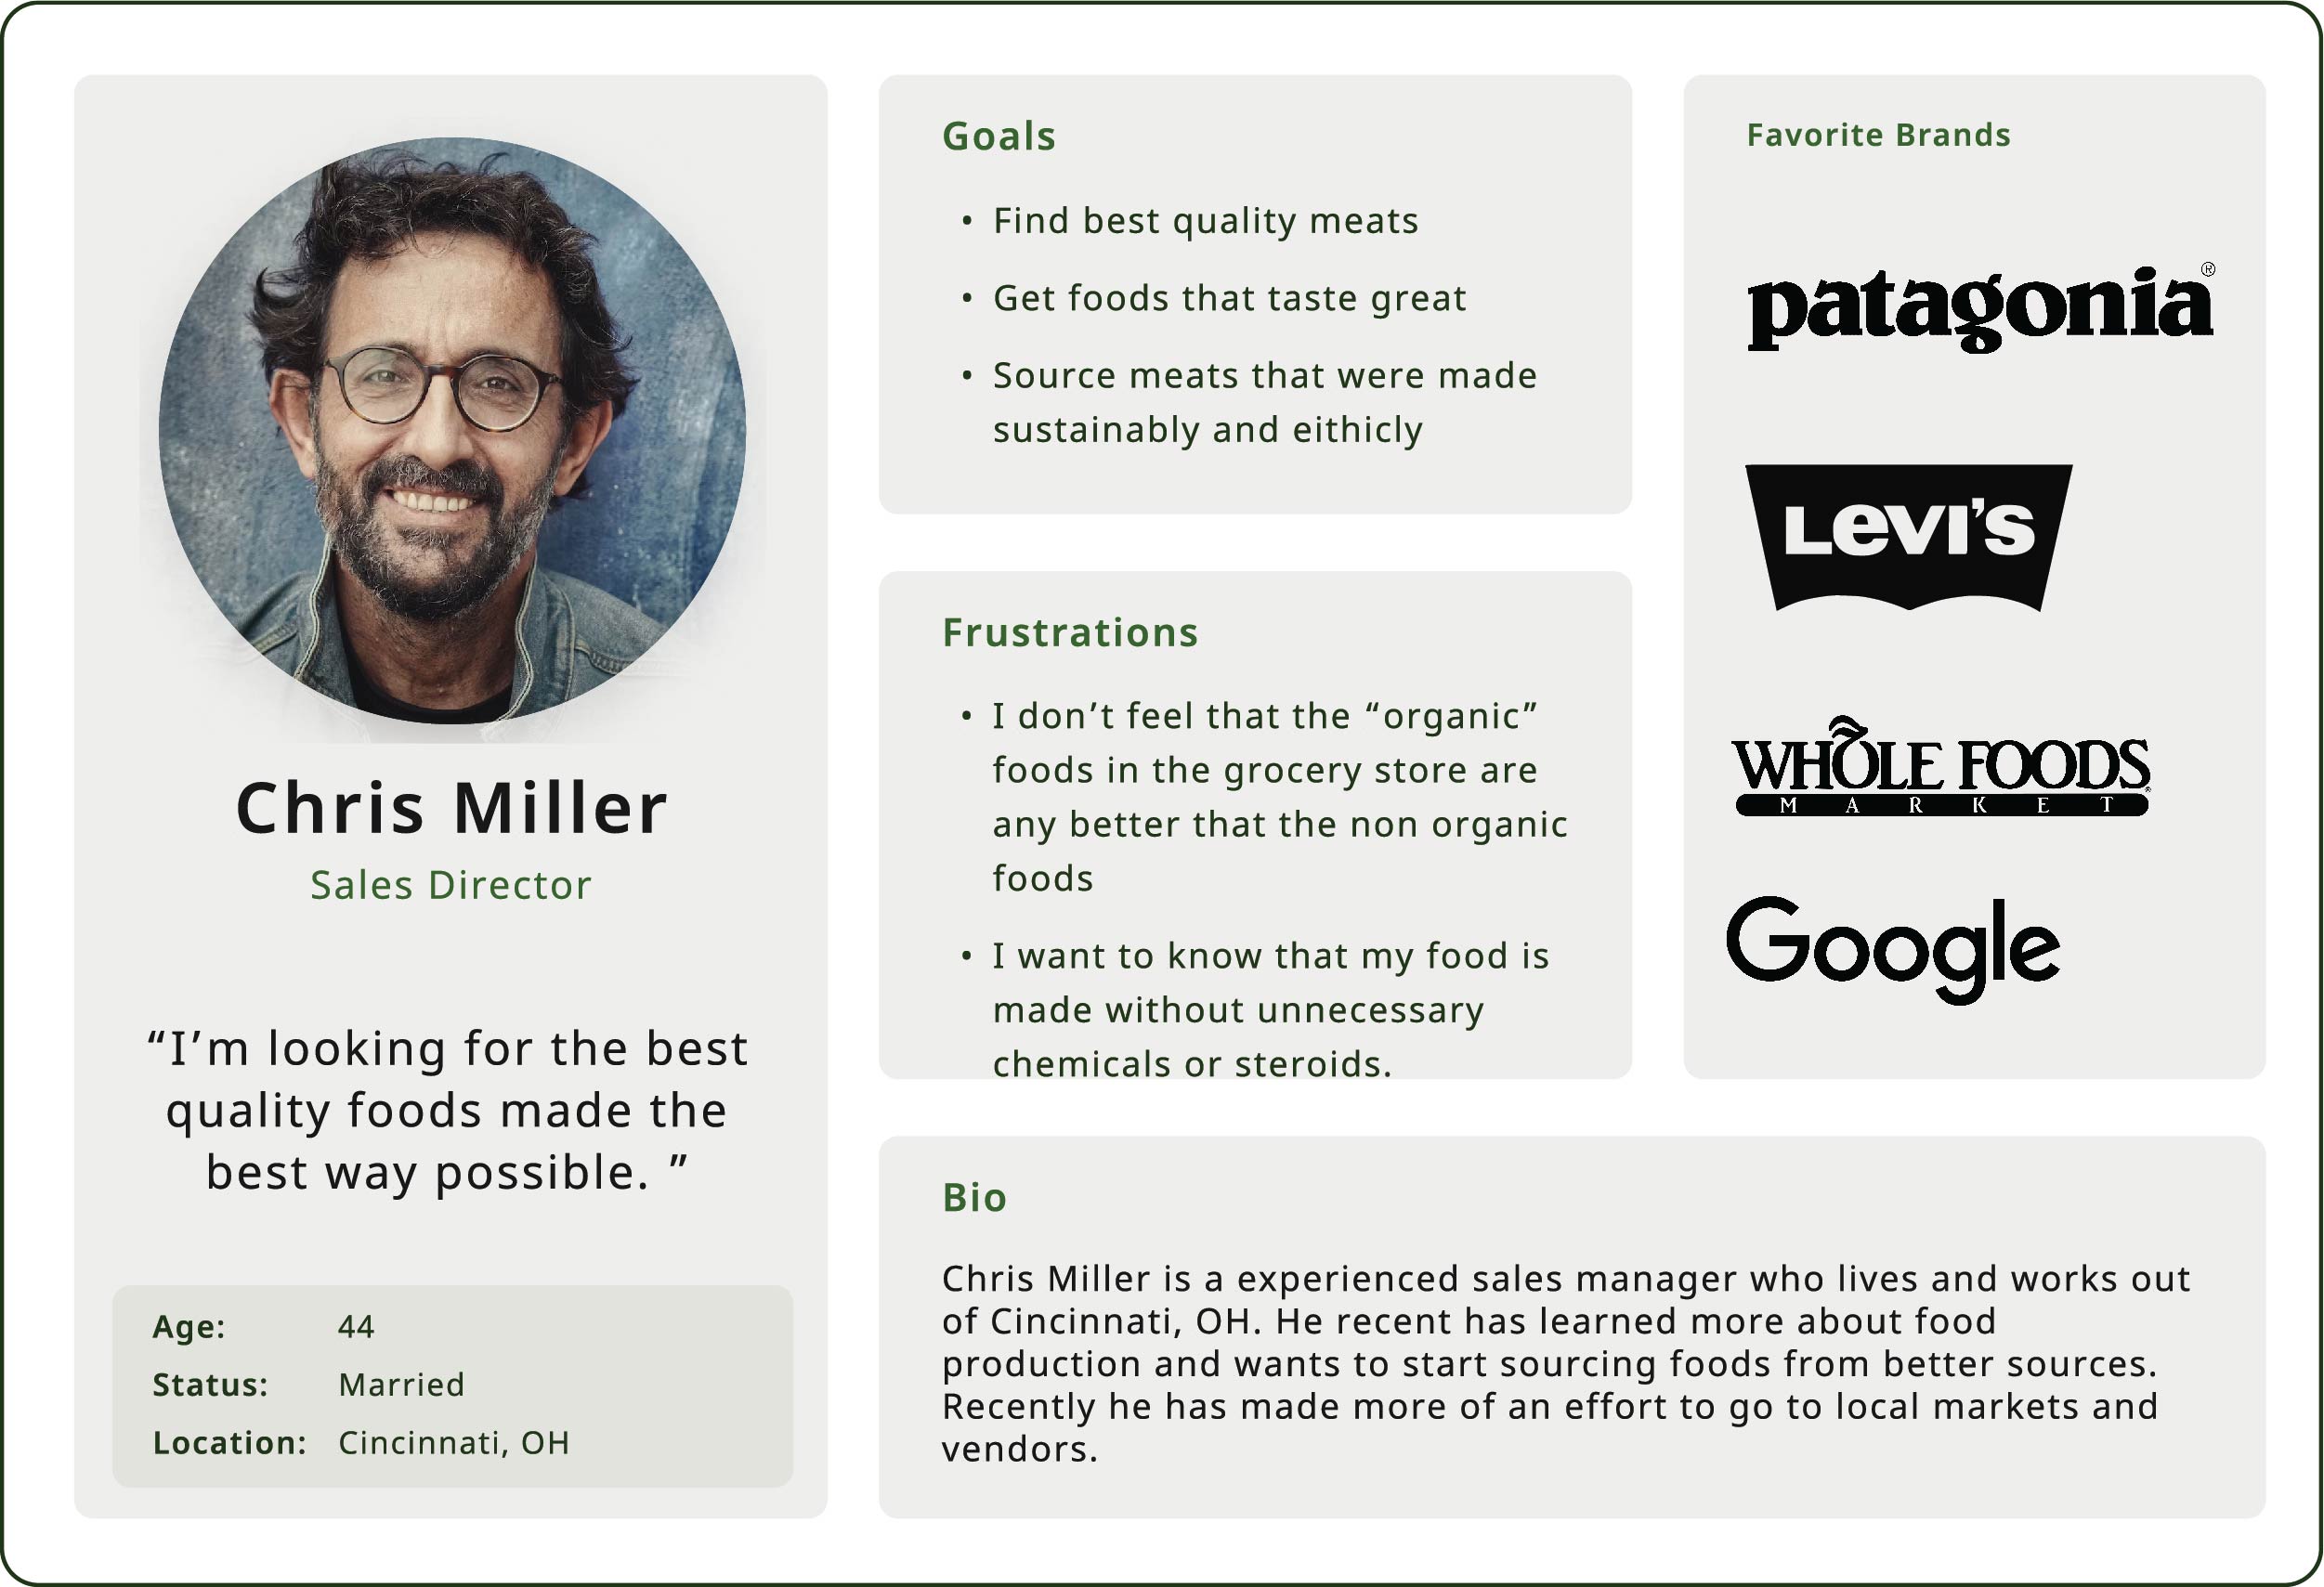
After analyzing the data we created these two user personas to represent the largest groups who attend the farmers markets. These will be used to inform design and strategy decisions moving forward.
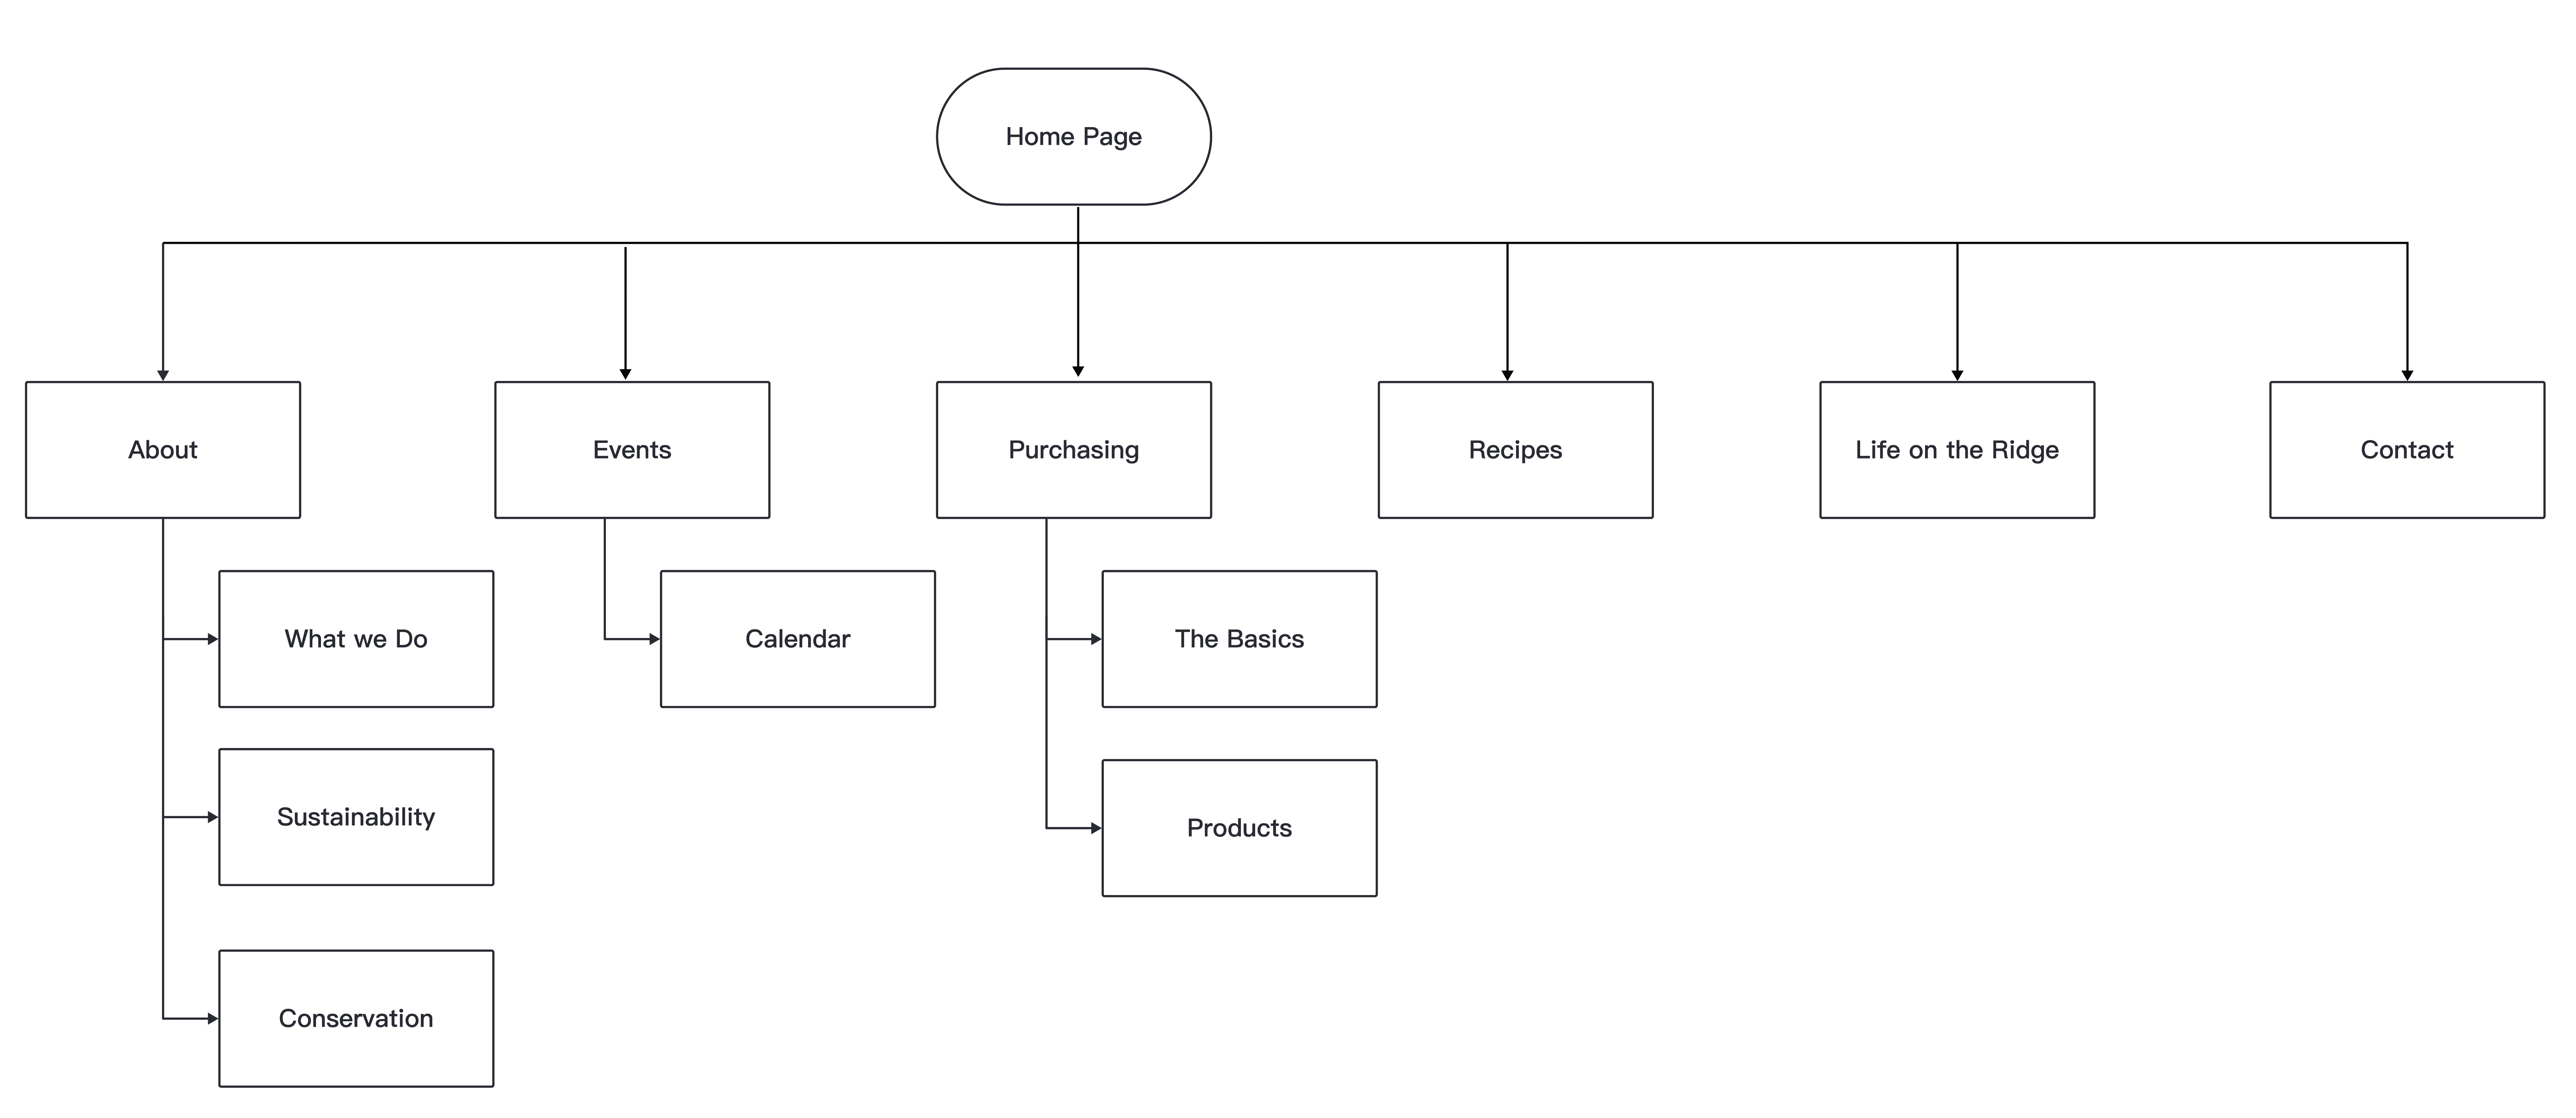
Current site map
To support our mission of making the farming and sustainability practices of Hampton Ridge Farm front and center we had to adjust our site map and information architecture. This would require removing some information and adjusting the hierarchy over all.
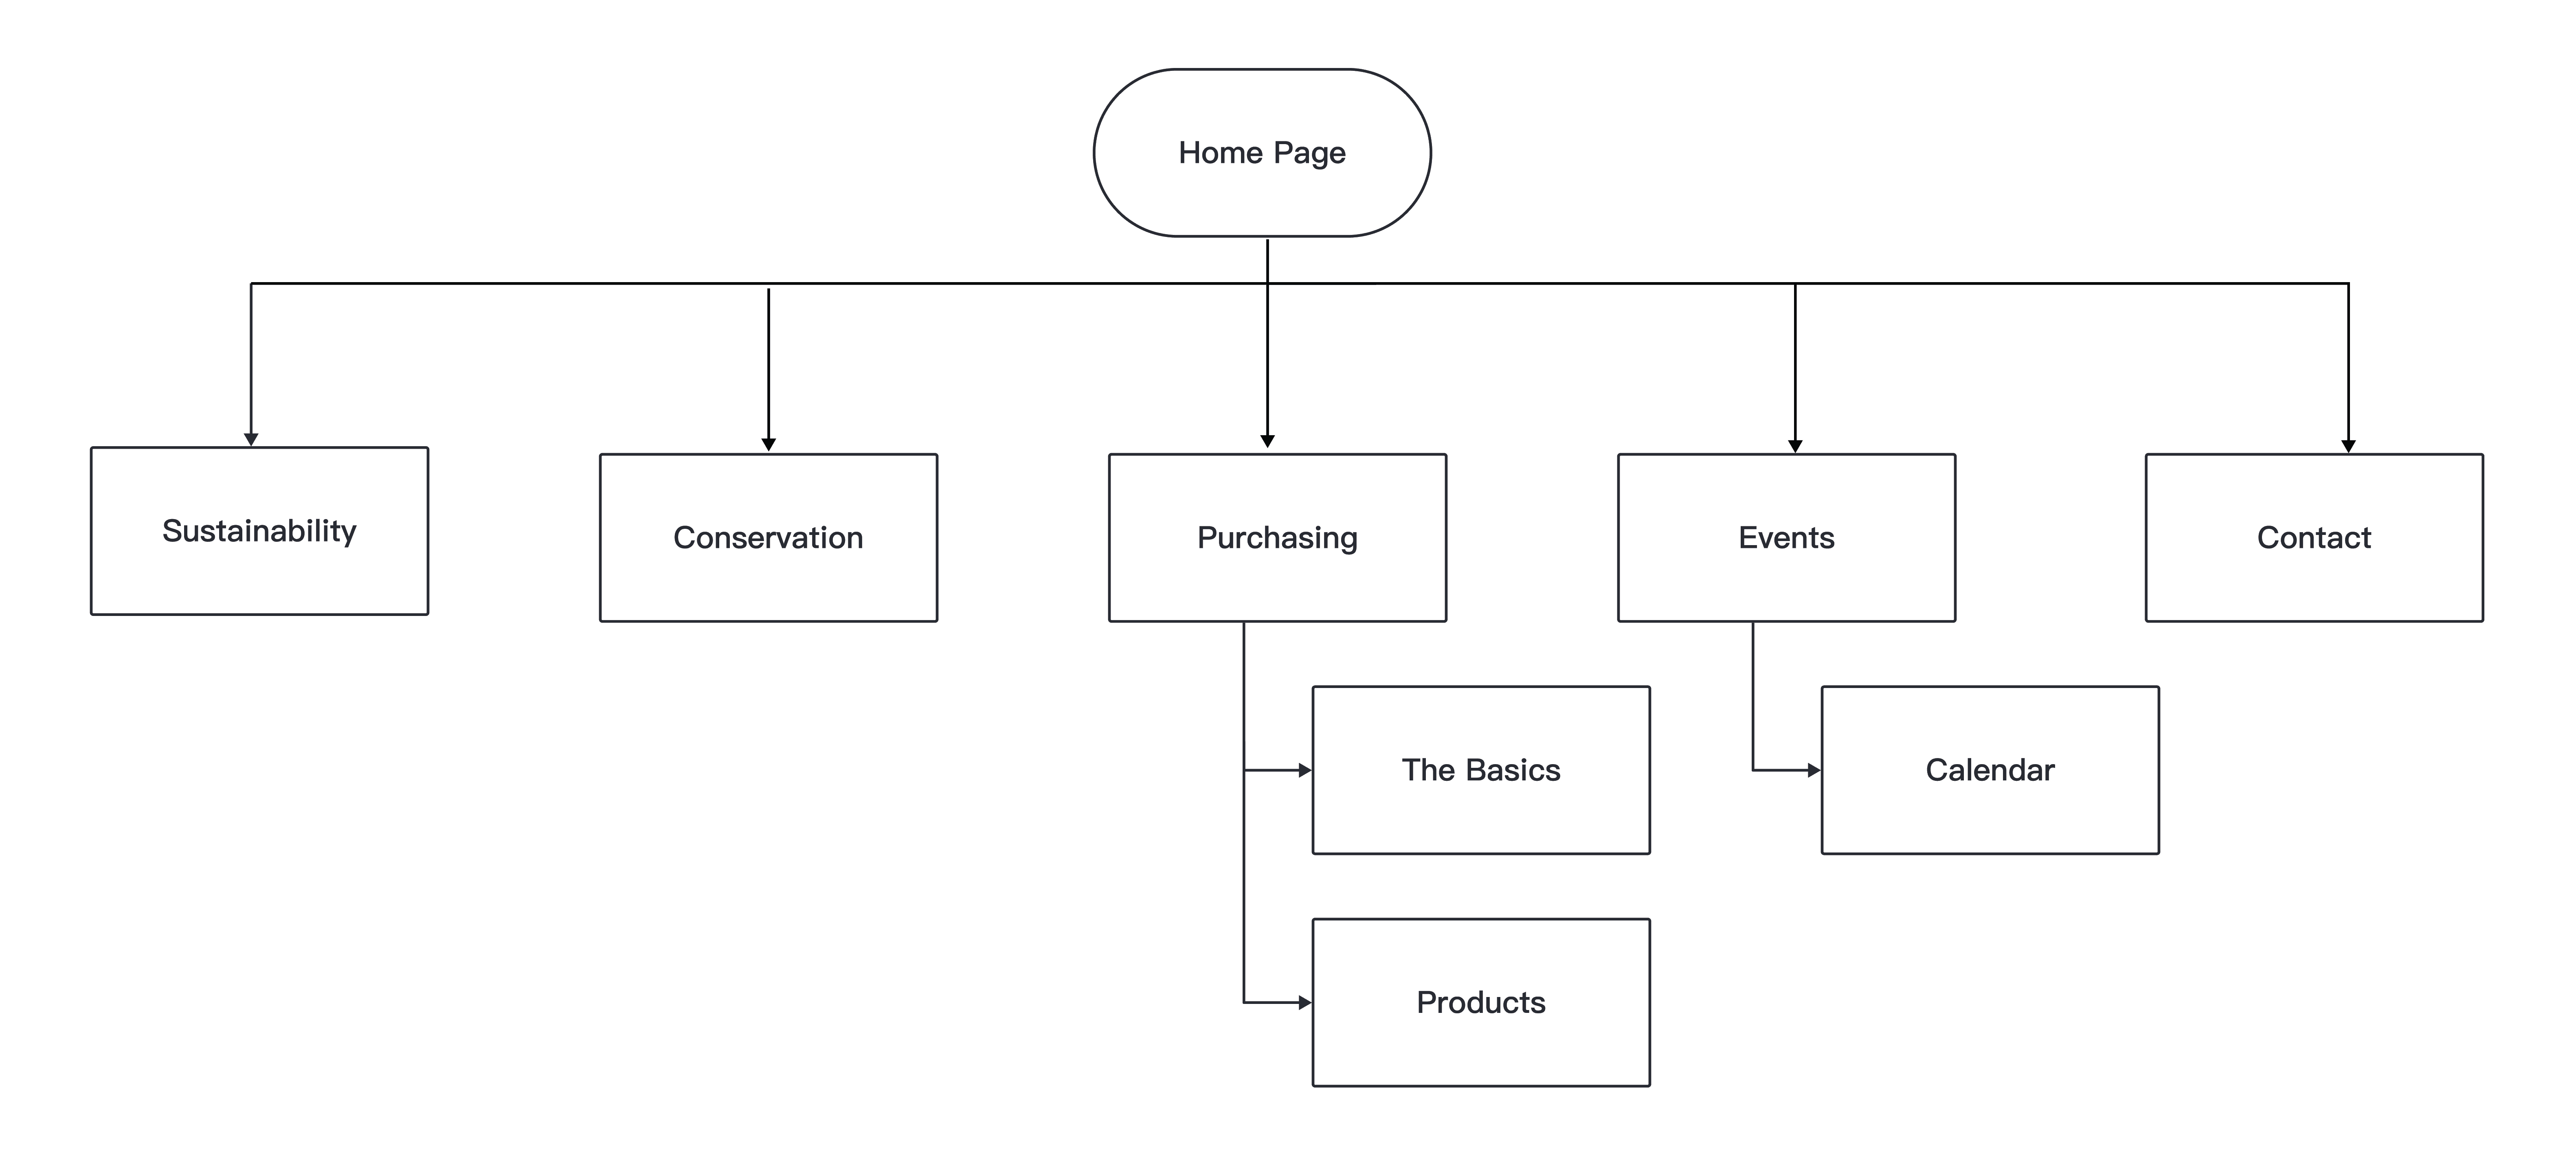
Revised site map
We decided to remove their recipes and blog page as they no longer have time to create content for those pages. By moving the sustainability and conservation to other own pages we could explore other practices more in-depth as well as make that information more readily available for there customers.
Up Next - Usability test
Who are we reaching and how are they getting here
Current website Demographics
Nearly all traffic is currently being pushed from in-person conversations Earl, the farm owner, has with his customers at the farmers market. This often means people are looking up the website on their mobile devices. This is supported by our analytics showing 60% of all traffic is on mobile. We also know most of this traffic is most likely through the in-person interactions as many are direct site visits or from google suggesting people are seeking out the site directly. We can also tell that people are not finding the information engaging as our bounce rate is at nearly 50%.
This set of data has given us clarity on how to prioritize our objectives. We will design the new site mobile-first and try to create a navigation and content structure that this more engaging to help reduce the bounce rate.
Farmers Market Patrons
The advantage of having a small pool of customers in this case is ease of access. We decided to conduct a survey; of the Covington KY Farmers market that Hampton Ridge Farms exclusively attends. We conducted two surveys, the first of which was to collect demographic data (age, gender, income, etc) and the second was to learn more about the behavior and purchasing decisions of the market. The charts below represent the results of these two surveys.
Age
Gender
Income
Do you consume meat products?
Do you consider farming practices when purchasing
Do you walk, drive, or use other transport?
What form of communication do you prefer?
Do you come for specific vendors or to browes?
The advantage of having a small pool of customers in this case is ease of access. We decided to conduct a survey; of the Covington KY Farmers market that Hampton Ridge Farms exclusively attends. We conducted two surveys, the first of which was to collect demographic data (age, gender, income, etc) and the second was to learn more about the behavior and purchasing decisions of the market. The charts below represent the results of these two surveys.
User Personas
After analyzing the data we created these two user personas to represent the largest groups who attend the farmers markets. These will be used to inform design and strategy decisions moving forward.
Current site map
To support our mission of making the farming and sustainability practices of Hampton Ridge Farm front and center we had to adjust our site map and information architecture. This would require removing some information and adjusting the hierarchy over all.
Revised site map
We decided to remove their recipes and blog page as they no longer have time to create content for those pages. By moving the sustainability and conservation to other own pages we could explore other practices more in-depth as well as make that information more readily available for there customers.